Racial Inequities in Housing Affordability
- The Chandan Economics Research Team

- Feb 27, 2024
- 1 min read
This is the first chapter of Chandan Economics's 2024 special report on Racial Inequities in US housing that explores economic performance outcomes in housing by race in household wealth, housing affordability, housing and environmental quality, and credit access.

In 2024 housing affordability remains one of the most stubborn and widespread challenges for the US economy. Home prices sit at all-time highs, while generationally high mortgage rates continue to keep would-be buyers and sellers stuck in neutral. Consequently, segments of the nation's housing demand have shifted back into rentals — revealing a deeper magnitude of both affordability constraints and racial inequities.
Rental Households in Poverty
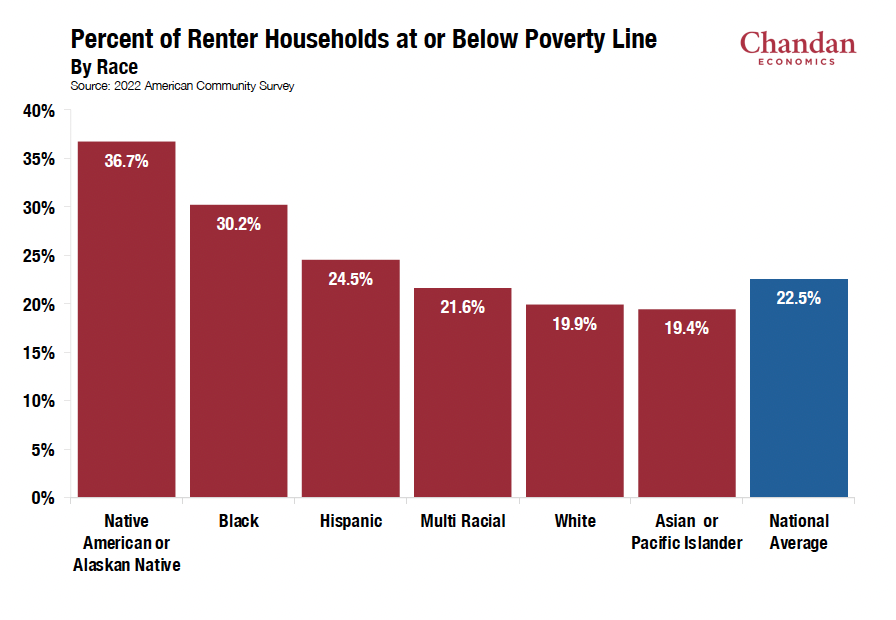
Utilizing federal poverty guidelines and household data from the 2022 American Community Survey (ACS) data, Chandan Economics estimates that the national average of renter households at or below the poverty line across households of all racial backgrounds sits at 22.5%. Moreover, racial disparities in incomes and homeownership rates have meant that Native American, Black, and Hispanic renter households are more likely to be income-constrained by rental costs.
Our findings indicate that nearly 37% of Native American or Alaskan Native and 30% of
Black renter households fall at or below the poverty line. Roughly 25% of Hispanic renter
households of all ethnicities sit at or below the poverty line. For households where the head
of household identifies as two or more races, the rate falls to 21.6%. Meanwhile, the poverty
rate for White and Asian renter households falls to 19.9% and 19.4%, respectively.
Educational Attainment & Upward Mobility
Underlying these demographic data is the outsized impact that higher education rates have on affordability outcomes. When concentrating our sample to only include heads of renter households with four (4) or more years of college experience, poverty rates not only drop significantly but display less variation across racial groups. According to Chandan Economics' calculations using 2022 ACS data, 13.1% of all renter households with a college degree fall at or below the poverty line compared to 27.3% of renters with some or no college experience.
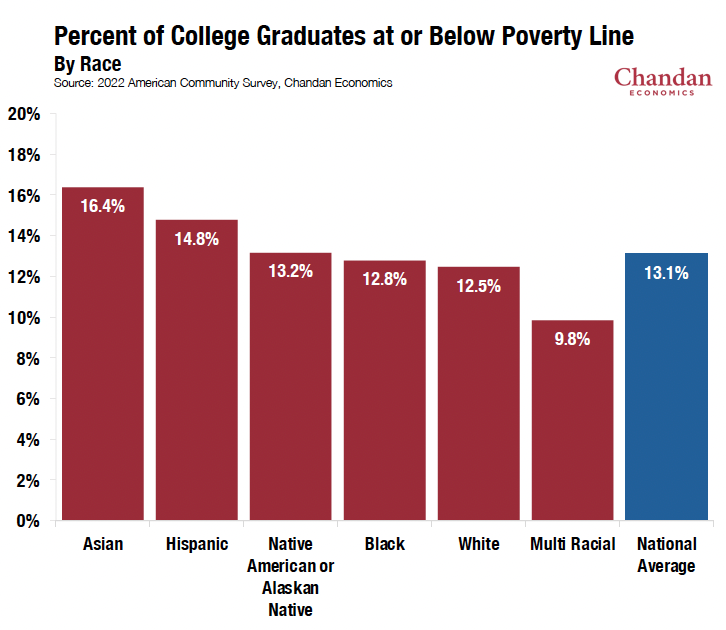
Here, racial disparities persist but diminish significantly. Before accounting for education rates, the gap between the highest and lowest average rates of poverty by racial group stretches to 17.3 percentage points but falls to just 6.6 percentage points when reduced to college graduates only. Asian American households in poverty are more likely to hold college degrees compared to other racial groups living in poverty, largely reflective of higher rates of degree attainment among Asian Americans.
Despite Hispanic Americans having significantly lower rates of degree completion as a group, they experience the second highest rate of households in poverty with a college degree, exposing an upward mobility conundrum for the demographic group. Specifically, there is evidence that Hispanic and Latino Americans encounter structural barriers in accessing housing assistance programs relative to other groups, which is explored further in Chapter 3 of our report.
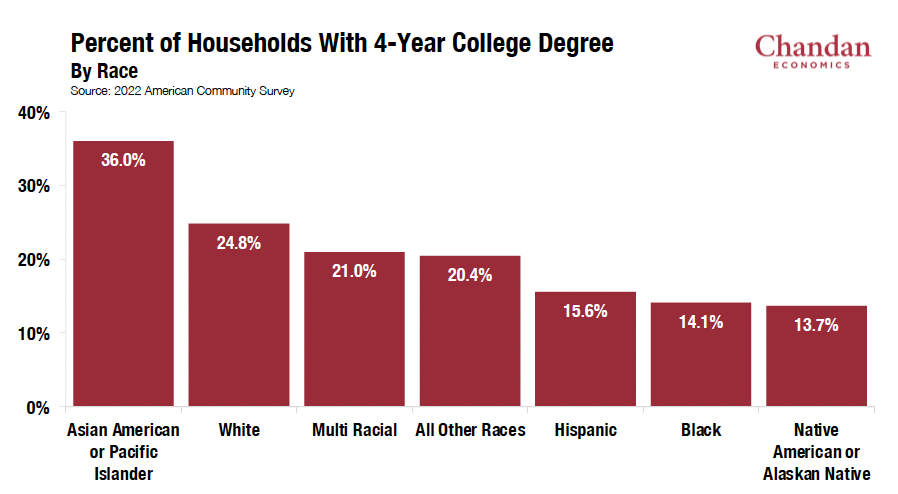
Black American households experience a significant drop in poverty rates when the head of household has a 4-year college degree, undercutting the national average by 30 basis points. These data suggest that there is a strong relationship between higher poverty rates and lower degree attainment rates among Black American households. Another residual effect of higher constraints for lower-income minority households is higher average cost burdens for higher-income White households.
According to a 2019 National Low Income Housing Coalition (NLIHC) review, White rental households are likelier than non-white rental households to have incomes above 80% of area median income — a standard metric for measuring housing affordability. However, White renters with higher incomes are more likely to be housing cost-burdened compared to non-White renters with similar incomes.
Household Crowding
Our analysis of household poverty rates by race illustrates a key part of the picture — however, it does not consider household sizes, which is an important weight in the ACS' calculation of poverty rates. For example, a head of household with an income of $70,000 per year may fall above the poverty threshold if their household only includes two people, while a similar head of household with four (4) dependents may fall under the poverty threshold.
While measuring someone's housing costs relative to their income is an obvious starting point to gauge affordability, looking at how much space is available to each house member can be another valuable guide. Previous research by the US Department of Housing and Urban Development (HUD) on housing's effect on various human outcomes, including health, education, and development, found an association between household overcrowding and adverse consequences for adults and children.
Our analysis specifically looks at the percentage of renter households with less than one bedroom per person. According to a Chandan Economics analysis of 2022 American Community Survey data, 10% of all US households live in units with less than one bedroom per person. Hispanic and Native American/Alaskan Native renters experience the most household crowding, with 29% and 24% of the respective populations sharing a bedroom with at least one other person, followed by 21% of Asian American or Pacific Islander rental households.
Black, Multiracial, and White renters are significantly less likely to experience household crowding than other races or ethnicities, but a notable gap between the cohorts remains. 13% of Black renters live in a unit with less than one bedroom per person, compared to 11% of multiracial households, 9% of all other racial groups, and just 7% of White renter households.

It is significant to note that differences in social and cultural preferences make it difficult to extrapolate major conclusions from these data. Further, historical inconsistencies in how demographic information was surveyed in previous Census studies somewhat limit our ability to conclude causality. Still, measuring average space availability— particularly in renter households— provides a practical way of analyzing crowding and its associated risks.
Broader Economic Impacts of Racial Inequities in Housing
The effects of income constraints stretch beyond simply the stress of paying rent. In a 2019 paper studying housing's impact on upward mobility, researchers at The Urban Institute compiled evidence showing how high shelter costs can limit future economic success. Individuals who spend a higher share of income on housing are more likely to experience slower savings accumulation. Moreover, high-cost burdens can often push people into lower-quality housing over time without much savings upside. The lack of affordable and available housing also drags local economic output, as residents spend less of their income on non-housing needs.


Comments